Guides · Treadmill incline pace chart
Treadmill pace chart with incline: the flat pace each grade is worth
Your plan says to run a tempo near 7:15 a mile, and you would rather run it at 7.0 with the deck at 4%. Before you start, you want to know those two really make the same session.
Each 1% of incline adds about the work of running 4.5% faster on a flat belt. So 7.0 mph at 4% takes roughly the effort of a 7:16 flat mile, as a starting point. Every row in the chart assumes your belt really runs the speed shown.
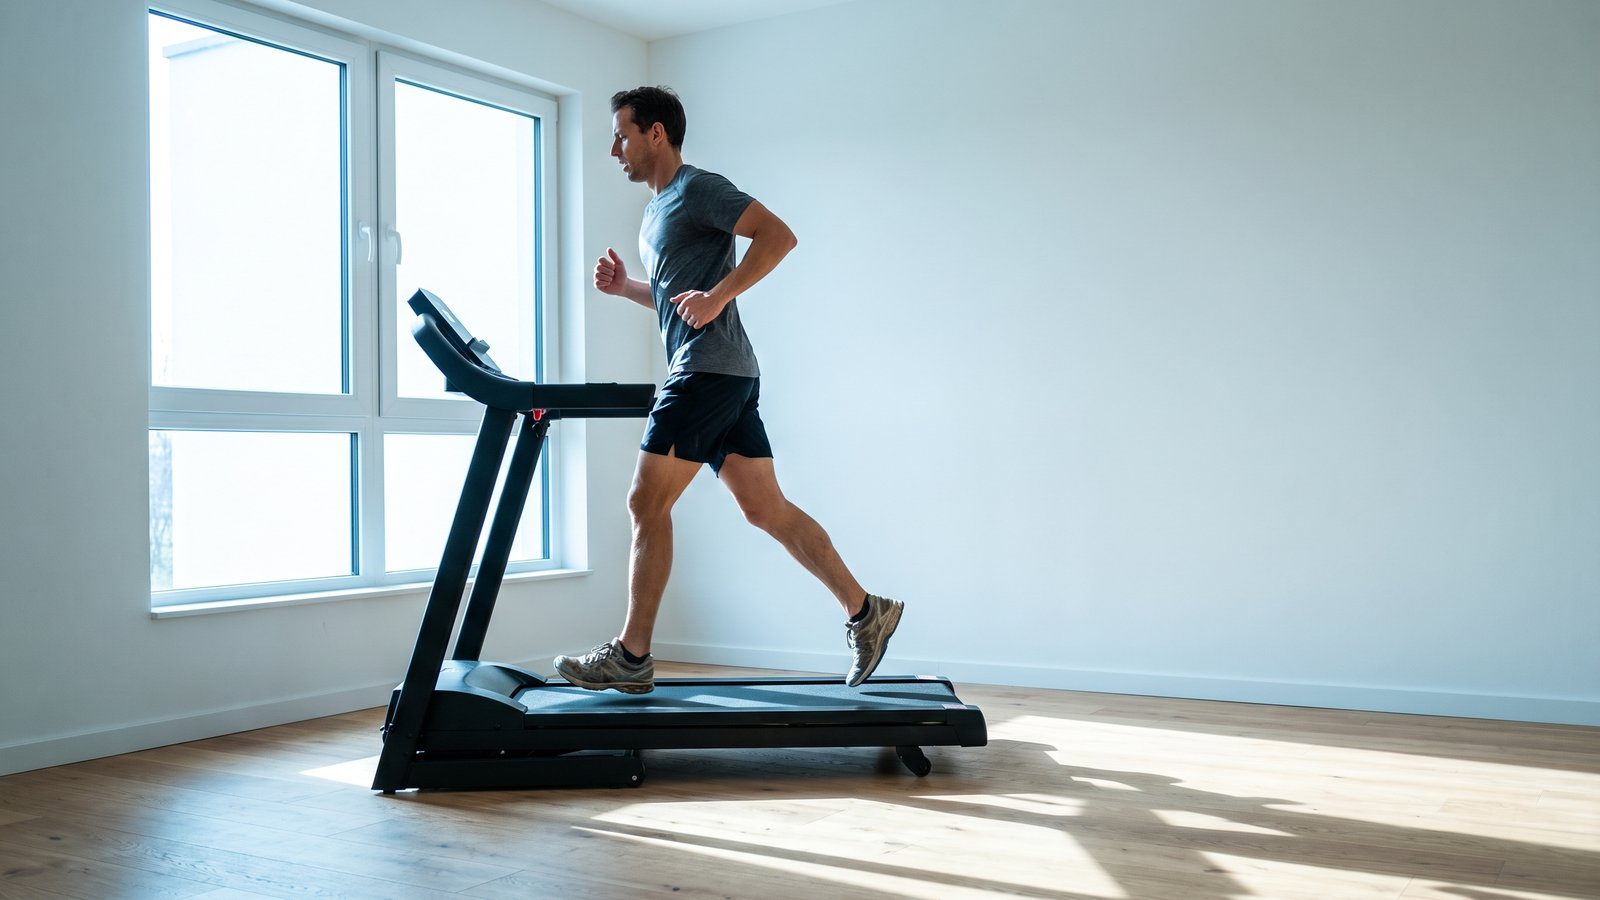
Treadmill incline pace chart, 5 to 10 mph
Flat pace per mile with the same effort
Find your speed row, then your grade column. The cell is the pace on a flat belt that takes about the same work. Swipe sideways on a phone to see every grade.
| mph | 0% | 1% | 2% | 3% | 4% | 5% | 6% |
|---|---|---|---|---|---|---|---|
| 5.0 | 12:00 | 11:29 | 11:01 | 10:34 | 10:10 | 9:48 | 9:27 |
| 5.5 | 10:55 | 10:26 | 10:01 | 9:37 | 9:15 | 8:54 | 8:35 |
| 6.0 | 10:00 | 9:34 | 9:10 | 8:49 | 8:28 | 8:10 | 7:52 |
| 6.5 | 9:14 | 8:50 | 8:28 | 8:08 | 7:49 | 7:32 | 7:16 |
| 7.0 | 8:34 | 8:12 | 7:52 | 7:33 | 7:16 | 7:00 | 6:45 |
| 7.5 | 8:00 | 7:39 | 7:20 | 7:03 | 6:47 | 6:32 | 6:18 |
| 8.0 | 7:30 | 7:11 | 6:53 | 6:36 | 6:21 | 6:07 | 5:54 |
| 8.5 | 7:04 | 6:45 | 6:29 | 6:13 | 5:59 | 5:46 | 5:33 |
| 9.0 | 6:40 | 6:23 | 6:07 | 5:52 | 5:39 | 5:27 | 5:15 |
| 9.5 | 6:19 | 6:03 | 5:48 | 5:34 | 5:21 | 5:09 | 4:58 |
| 10.0 | 6:00 | 5:44 | 5:30 | 5:17 | 5:05 | 4:54 | 4:43 |
Worked out with the standard running equation from exercise science, where each point of grade counts like running 4.5% faster on the flat.
Where one tested incline chart stopped holding up
A lab took one popular online incline chart and checked it on experienced runners. Each runner went through stages the chart called equal, while the lab measured how hard their body was working at each one. Up to 4% grade, the equal settings showed no measurable difference in cost. At 6% and steeper they cost more, because the chart did not slow the runner down enough to pay for the hill. The same study found that the running equation our table uses can be a poor fit for trained runners. Our table stops at 6% because nothing here supports going steeper. Treat the 5% and 6% columns as rough, since the one tested chart held only up to 4%. No lab has tested this table itself.
Flat belt or level road? Why two charts disagree
Our table converts to a flat belt. Each cell is the pace that feels the same on the same treadmill with the deck down. At least one popular online chart converts to a level road, not a flat belt. Its own FAQ says you might start near 7.8 mph on a flat belt for the effort of an 8:00 road mile, so its 0% column does not simply turn your speed into pace. That is why two charts can disagree on the same setting. Outside you also push through still air, which the belt never asks of you, and a small grade is the usual way to make up for it. The guide on where the 1% incline habit comes from covers that half.
Every row trusts the speed
A wind chill chart folds the temperature and the wind into one feels-like number. If the porch thermometer reads five degrees warm, the chart is wrong too. An incline chart folds speed and grade into one feels-like pace in the same way. The grade half has its own check, and the guide on whether your incline is accurate looks at whether your deck's zero is really zero. The speed half is the belt.
Say you set 7.0 at 4% on a belt that runs 2% slow, so it really moves at 6.86. That is a made-up belt inside the band one lab study found on four treadmills, where average belt speed ran about 98 percent to 103 percent of the set speed. That session is worth about a 7:25 flat mile, not the 7:16 in the table, and the cell is off by the same share as the belt. Your next race-pace plan starts from the wrong number.
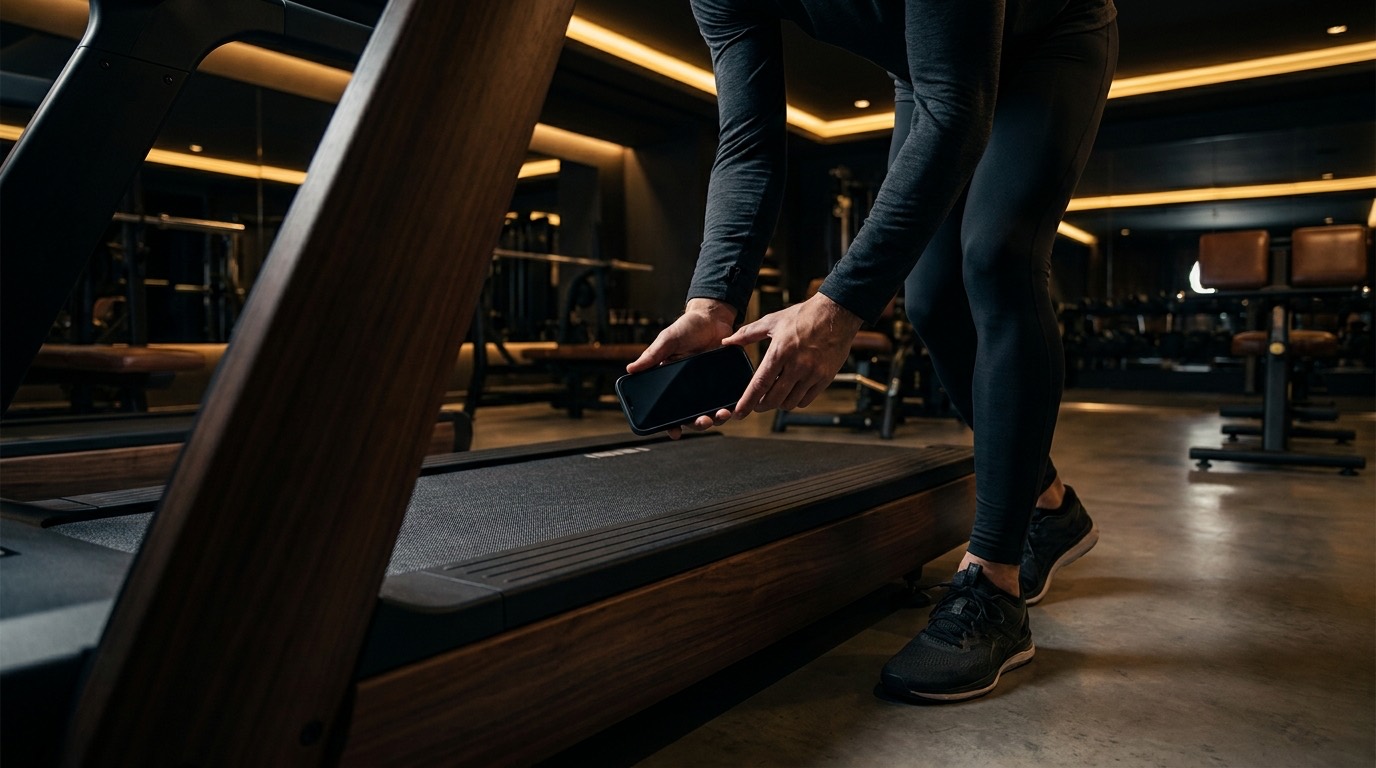
Treadwell reads the belt itself. It gets the true speed from an iPhone Pro's LiDAR and camera. As a first check, put the deck back to flat and take a reading at 7.0, or at the warm-up and easy settings you already run. Then look up the row for the speed your belt truly runs, not the one you pressed.
Check the speed your chart row stands on
Read the belt with the deck flat at your easy setting before your next incline tempo. It takes an iPhone Pro. The distance your incline session logged rests on the same speed, which the guide on how to read treadmill distance explains.
 Scan with your iPhone Pro to get the app
Quick answers
How does a treadmill incline pace chart work? Each 1% of incline adds about the work of running 4.5% faster on a flat belt. So 7.0 mph at 4% takes roughly the effort of a 7:16 flat mile, as a starting point. Every row in the chart assumes your belt really runs the speed shown.
Does incline on a treadmill make your pace faster? No. The belt is set to the speed shown, and your pace and distance come from the speed the belt actually runs. Grade changes how hard each mile feels. The climb itself is covered in the guide on whether incline adds distance on a treadmill.
Is the incline pace chart accurate above 6%? Treat it as rough from 5% up. The one lab test we found covers the single chart it checked, not every chart, and that chart held only to 4%. Nothing here supports going steeper.
Does the incline pace chart work in km? Yes. Each point of grade counts like 4.5% more speed in any unit, so at 4% you multiply your km/h by 1.18. Then look up that flat speed in the treadmill speed to pace chart, which lists kilometer paces too.
Sources.
- The running equation behind the grid: the American College of Sports Medicine running equation, as written out in Dugas and colleagues, Sports (Basel), 2023, volume 11, article 235. Its grade term makes each 1% of grade cost as much as 4.5% more speed. The authors note the equations were built for steady-state exercise.
- The tested chart: Foreman, Lee and Lundstrom, "Assessment of a Treadmill Speed Incline Conversion Chart: A Validation Study," International Journal of Sports Physiology and Performance, 2022, volume 17, pages 1030 to 1036. They tested the HillRunner.com conversion chart on experienced runners and concluded it held only at or below 4% grade, with oxygen cost rising at 6% and above. They also cautioned against using the ACSM equation for trained runners.
- Road effort versus flat belt: HillRunner.com, "Treadmill Pace Conversions FAQ," January 5, 2017. The chart's author says its paces match level outdoor running and gives about 7.8 mph at 0% for an 8:00 outdoor effort.
- Real belt speed with people on it: Willwacher's team, writing in Scientific Reports in 2021 (vol. 11, no. 2244). Its four lab treadmills, one heavily worn, kept average belt speed in a band from about 98 percent up to 103 percent of the chosen speed.
- The 1% habit: Jones and Doust, Journal of Sports Sciences, 1996, volume 14, pages 321 to 327.
- My own notes: I worked out every grid cell from the running equation. The belt running 2% slow is invented for the example, and no machine of mine was measured for it. The wind chill chart is an illustration.